League of Legends data study
Comparing what tends to win League of Legends games in 2020 and 2024, and why the comparison doesn't fully hold up
- What it is
- An assessed project from my technical training, April 2024
- Data
- About 9,900 games (2020), 1,847 unique games (2024)
- Built with
- Python, Pandas, SQLAlchemy, MySQL
- When
- 2024
The question
This was an assessed project during my technical training in 2024. League of Legends patches keep changing how much the various objectives are worth, and I wanted to find out which in-game stats went with winning, and whether that had shifted between 2020 and 2024.
For 2020 I used a public dataset of about 9,900 high-rank games. For 2024 there wasn't anything equivalent available, so I pulled the games from the Riot Games API myself.
Getting the 2024 games
There's no API call that returns recent high-rank matches, so I had to go through the players instead. I started by fetching the top 300 or so players on the ladder, looked up each player's account and their recent match IDs, and then downloaded the details of each match, which comes back as a large JSON document per game.
The free API key only allows 100 requests every two minutes, and this needed well over 600, so I throttled the requests and saved the results of each stage to JSON files as I went. That also meant I could stop and restart the script without having to fetch everything again.
Something I hadn't expected was that asking for 3,000 games only gave me 1,847 different ones. At the top of the ladder the same few hundred players keep ending up in each other's games, so their match histories overlap a lot.
Making the two years comparable
The 2020 data has one row per game with totals for each team, whereas the API gives you all ten players separately. I rebuilt the same team-level columns for the blue side (kills, deaths, assists, wards, dragons, heralds, towers, gold and experience difference) and added the objectives that didn't exist yet in 2020. On the 2020 side I dropped columns that mirrored each other, like red kills and blue deaths, after checking a correlation matrix. I then loaded both tables into MySQL with SQLAlchemy and lined them up there.
What it suggested
In 2024, dragons and towers were much more strongly linked to winning than they had been in 2020, which fits with patches that made dragons give permanent bonuses and added bounties for towers. First blood mattered less, which also makes sense given the comeback mechanics that have been added since. Vision, meaning wards placed and destroyed, was only weakly linked to winning in both years.
Where the comparison runs into trouble
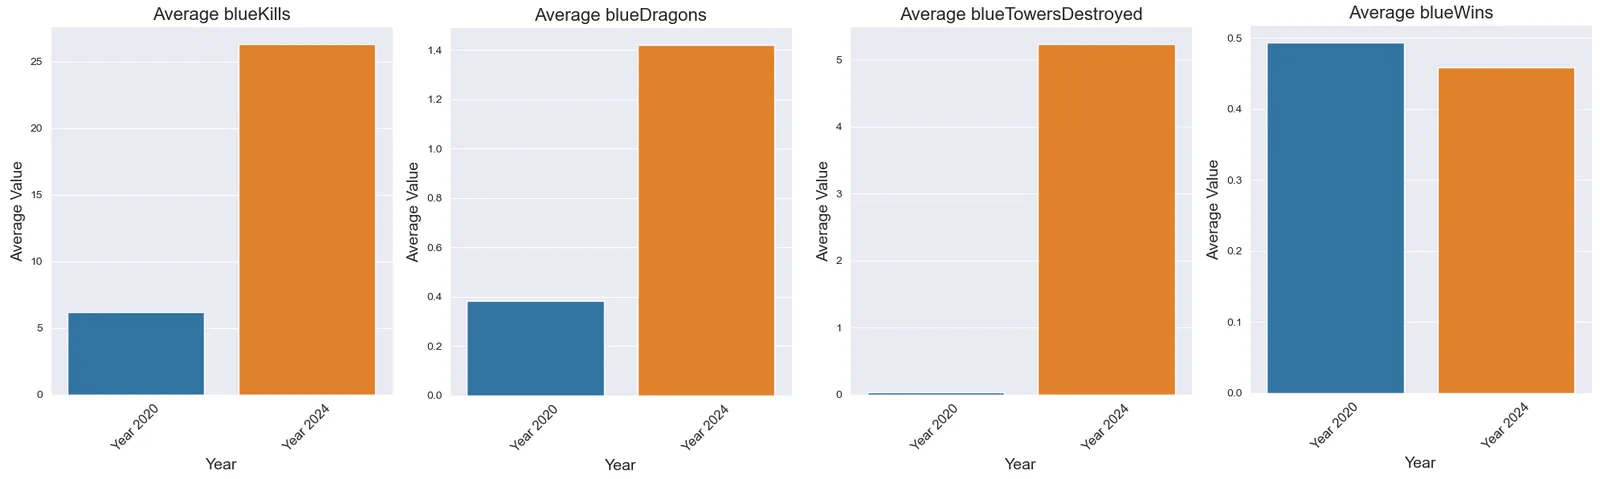
The charts at the top of the page come straight from my notebook, and the 2024 bars look enormous next to the 2020 ones. Most of that difference is because the 2020 dataset only covers the first ten minutes of each game, while the API returns whole games. The correlations within each year still tell you something useful, but comparing the raw numbers between the two years doesn't, so the write-up only draws conclusions from the within-year correlations.
About the repository
The repository has the notebook, the cached data, both loaded tables and the modules that request accounts and match IDs. The notebook is the most complete record of how the analysis was done, from the first API call to the final charts.
What I'd do differently
I'd use the match timeline endpoint to cut the 2024 games off at ten minutes, which would make the two years comparable. I'd also remove duplicate match IDs before requesting the details, to save rate-limited calls, and I'd go beyond correlations by fitting a simple logistic regression and testing it on games it hadn't seen.
If you'd like to keep reading, the next project is Global equity indices: a Tableau dashboard about how the Asia-Pacific stock markets drifted apart after 2019.