Global equity indices
A Tableau dashboard about how the Asia-Pacific stock markets drifted apart after 2019
- What it is
- A dashboard published on Tableau Public, March 2026
- Data
- Major indices, 2019 to June 2024
- Built with
- Tableau
- When
- 2026
Open the live dashboardRepository
What it's for
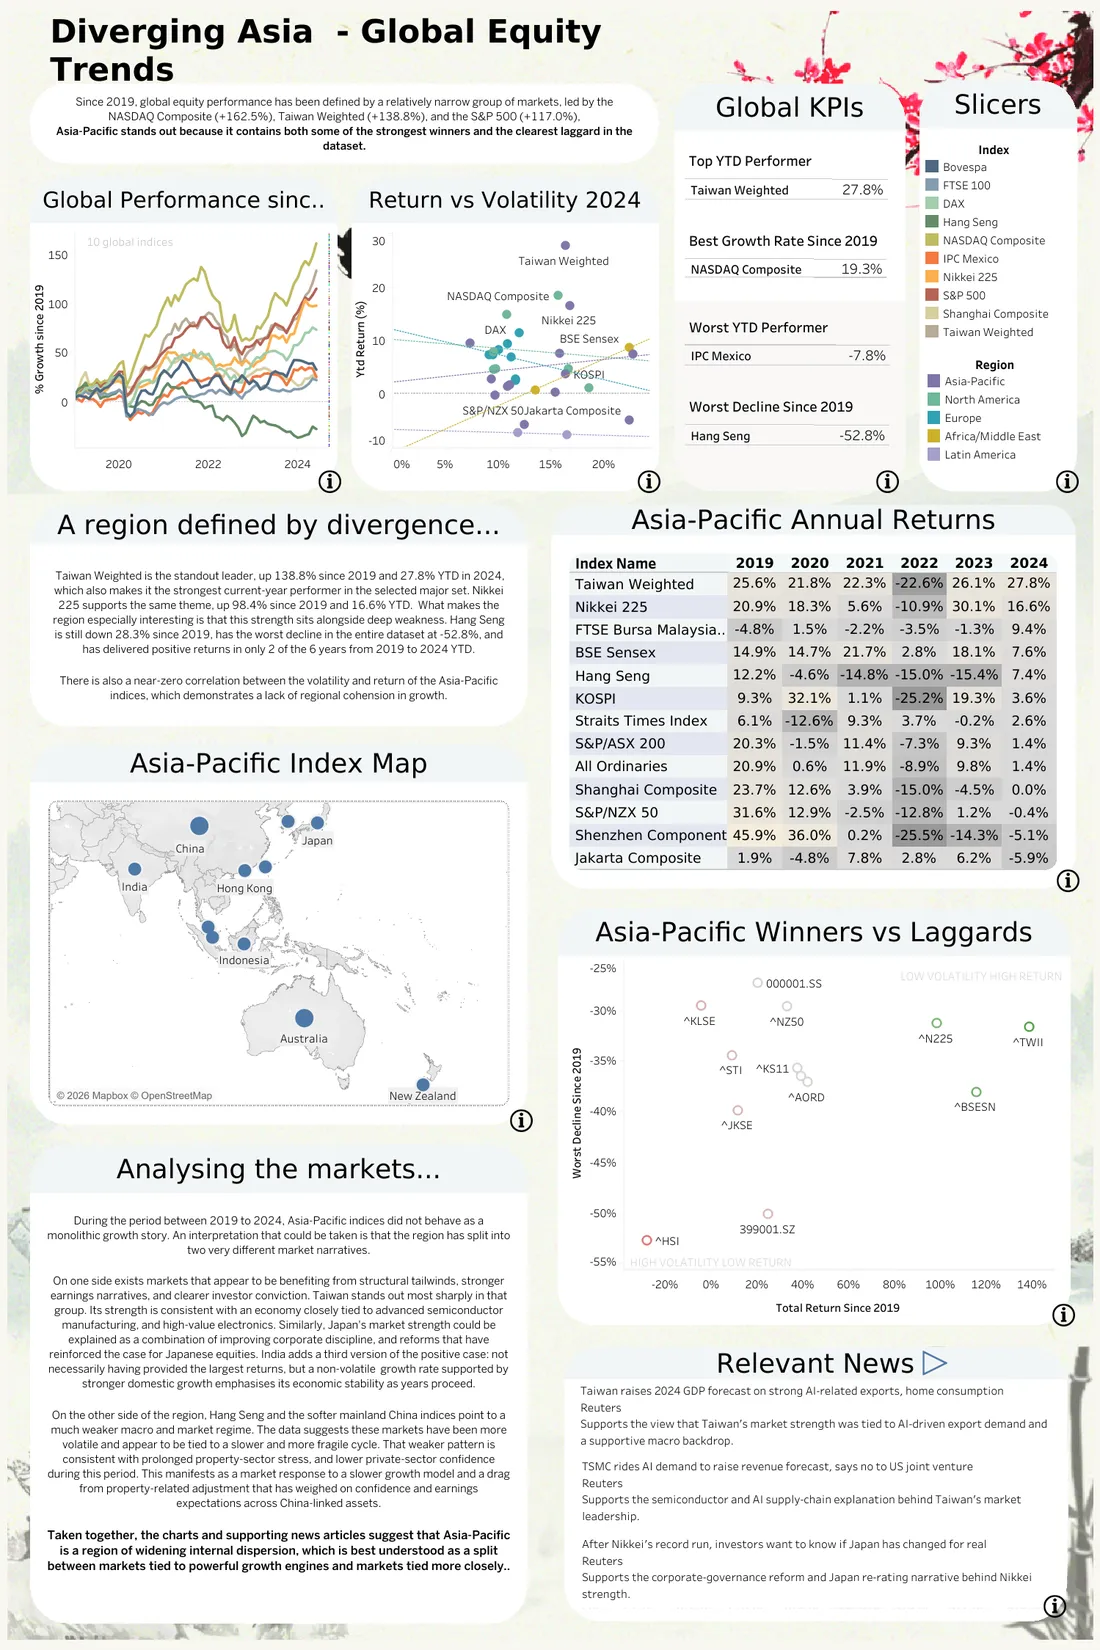
I wanted to build a single page that would answer a fairly simple question: how have the world's major stock markets done since 2019, how bumpy has that been, and which markets are ahead this year? Once I started looking at the data, the most interesting part was Asia-Pacific, where the markets had drifted furthest apart, so the dashboard ended up focusing there.
How I put it together
The dashboard has three main views on one screen. The first shows performance since 2019 with every index rebased to 100, the second plots this year's return against volatility, and the third is a table of annual returns by market. Each view answers one question and leaves the others to the rest of the dashboard.
The long-run chart and the table only use ten headline indices, because with more than that they became hard to read, but the scatter uses a wider set to give more context for the current year. Since that difference could easily confuse someone, the dashboard says which set each view uses.
Along the top are a few headline figures: the best and worst performer this year, the strongest growth since 2019 and the deepest fall. Each of them has a definition next to it, because a label like "best market" can mean several different things. I also wrote out the main points in a short piece of text beside the charts, together with the things the data can't tell you.
What it showed (up to 24 June 2024)
Taiwan's index was leading the year, while the NASDAQ Composite had grown the most since 2019. Among the headline indices, Hang Seng had the deepest fall, and the Latin American markets were lagging in 2024.
What I'd change
Most of the time went into deciding what to leave out. Next time I'd show a draft to two or three people before publishing it, to check that they read the charts the way I intended before the layout was fixed.
If you'd like to keep reading, the next project is Polymer structure search: research code from a summer placement at Cambridge that generates random polymer structures and relaxes them with a force field.